
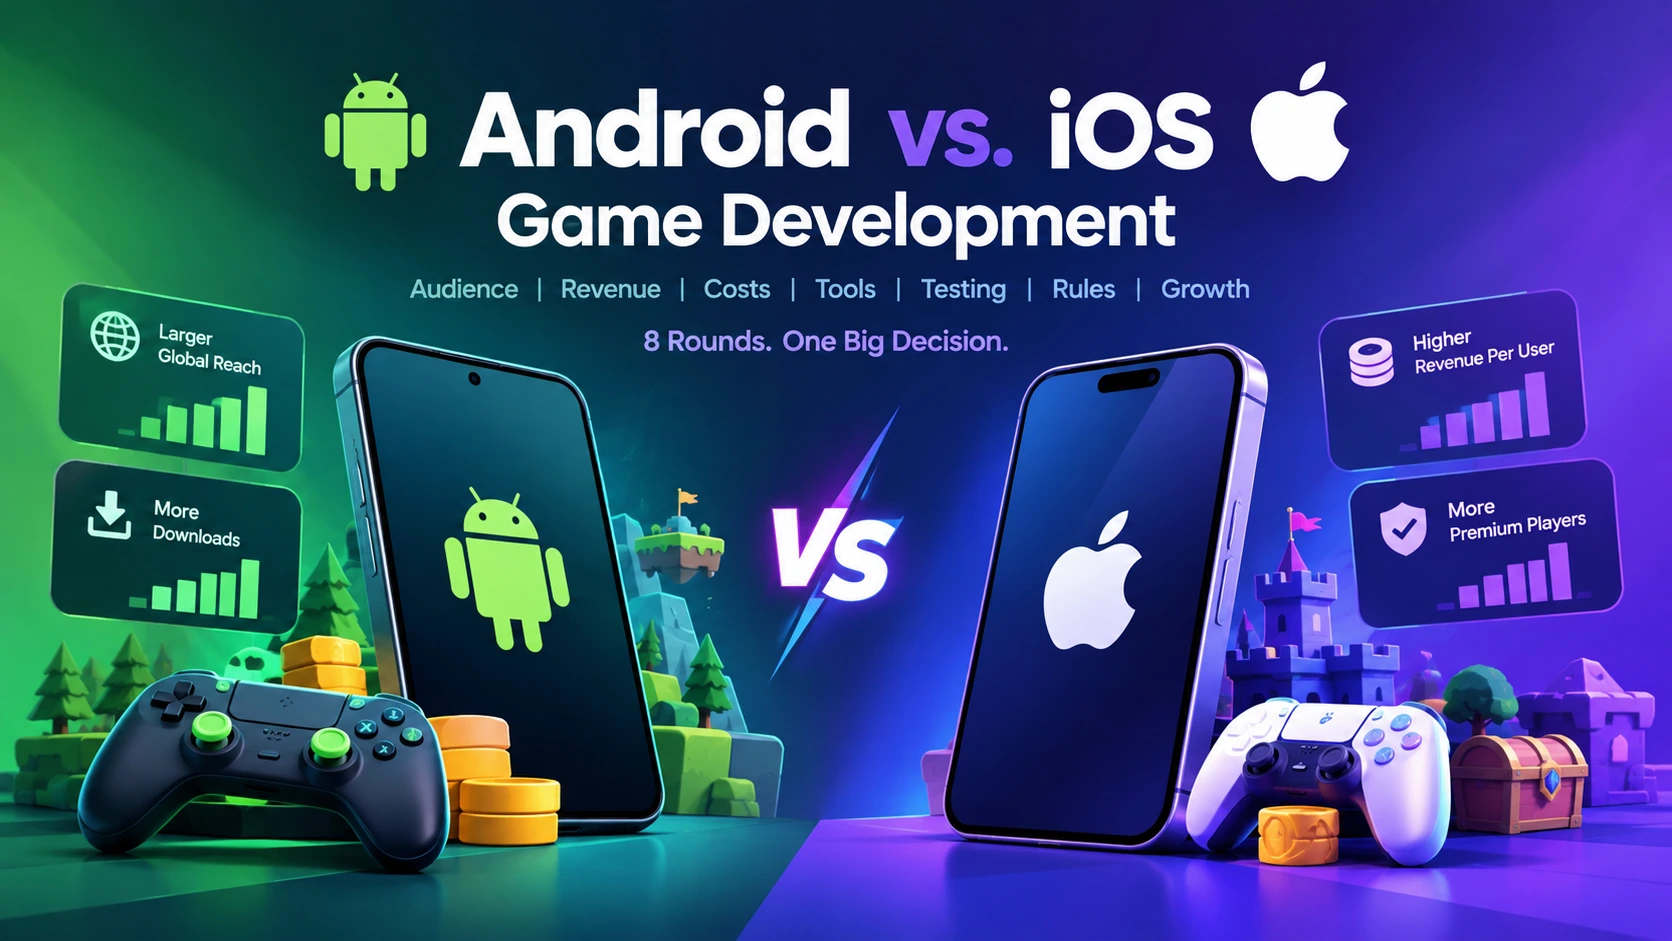
Every few years someone declares the platform war over, and every few years the numbers refuse to cooperate. Android owns the planet. iOS owns the wallet. Both statements are true at once, and the gap between them is exactly where a studio’s launch plan either works or quietly bleeds money.
This mobile platform comparison is a head-to-head scorecard. It runs eight rounds, from audience size and revenue to store rules and testing pain, with a verdict for each and a decision guide at the end. Anyone weighing Android vs iOS game development will find that the answer changes with genre and geography. Figures come from published market data and are dated, because this market moves fast and platform fees in particular changed materially in 2026. Treat any fee number here as a snapshot and confirm current terms before you sign a budget.
The Fight Card
| Round | Topic | Edge |
| 1 | Reach and audience | Android |
| 2 | Revenue and spending | iOS |
| 3 | Cost of entry and fees | Depends on your numbers |
| 4 | Development tools and tech | Even |
| 5 | Device fragmentation and testing | iOS |
| 6 | Publishing and store rules | Depends on your patience |
| 7 | Monetization and advertising | iOS, with caveats |
| 8 | Growth and market direction | Android, narrowly |
Read the verdicts as tendencies, not laws. A game’s genre, price point, and target countries can flip nearly any round.
Round 1: Reach and Audience
Android is the bigger network. StatCounter’s mobile web data for January to September 2026, as reported by MobiLoud, puts Android at 68.5 percent of global traffic and iOS at 31.3 percent. Those figures measure web traffic, not devices sold, so treat them as a proxy for real usage. The same source notes that iOS’s global share has climbed from 27.9 percent in 2024 to 26.9 percent in 2025, its highest yearly figure since 2009.
The global number hides a sharp regional split.
| Region or Country | iOS | Android |
| North America | 58.4% | 41.5% |
| Oceania | 60.0% | 39.8% |
| Europe | 39.0% | 60.8% |
| Asia | 21.1% | 78.8% |
| South America | 18.6% | 81.4% |
| Africa | 16.6% | 83.3% |
| United States | 59.8% | 40.1% |
| United Kingdom | 50.8% | 49.0% |
| Germany | 35.5% | 64.2% |
| India | 6.3% | 93.7% |
Source: StatCounter mobile web traffic, January to September 2026, via MobiLoud.
Downloads tell the same story. For 2025, Google Play accounted for about 73.5 percent of app downloads and the App Store for 26.5 percent, and Google Play logged roughly 42 billion game downloads, more than four times the App Store’s total.
Verdict: Android. If installs, brand awareness, or emerging markets matter most, Android is the bigger arena. A game built for India, Brazil, or Indonesia that ignores Android is ignoring most of its audience.
What Can Actually Be Outsourced?
Game art outsourcing covers a wide range of disciplines: 2D and 3D character design, environment art, UI and UX design, concept art, marketing and key art, animation, and technical art like rigging and shader work. A studio can outsource a single asset category or run an entire art pipeline through an external partner, depending on internal capacity and budget.
Round 2: Revenue and Spending
Reach is only half the equation. Per user, iOS players spend more, and the totals show it. Across iOS vs Android games, the spending pattern is consistent even where the audience sizes are not. In 2025, according to the same market report, consumer spending on the App Store reached about $117 billion against roughly $49 billion on Google Play, around 70 percent against 30 percent. For games specifically, the App Store took about $52.5 billion against $30 billion for Google Play, meaning iOS captured roughly 64 percent of mobile game spending from a smaller share of users.
Momentum matters too. Google Play spending grew about 10 percent year over year in the second quarter of 2026, compared with about 3 percent for the App Store, so the gap is narrowing even as it stays large.
Verdict: iOS. If revenue per player drives your model, as it does for premium titles and spend-heavy free-to-play games, iOS pays more per install. Android compensates with volume, and a game with strong ad monetization can earn well from sheer scale.
Round 3: Cost of Entry and Fees
Both platforms charge for the privilege.
| Item | Apple | |
| Developer account | $99 per year | $25, one-time |
| Standard commission on digital sales | 30% | Being restructured, see below |
| Reduced commission | 15% for developers in the Small Business Program, earning under $1 million per year | Tiered rates, see below |
Apple’s terms are the simpler of the two, though they are the subject of ongoing legal action. A U.S. court ruling in April 2025 barred Apple from charging a fee on links that send U.S. users to outside purchase options, and Apple has collected nothing on such link-outs since. In August 2026, Apple filed a court-ordered proposal for a link-out commission of 15 percent for standard apps, 10 percent for certain partner programs and subscription renewals, and 5 percent for Small Business Program apps. That is a proposal, not a final fee, and the court will decide. Apple’s appeal is also headed to the Supreme Court.
Google’s structure changed after its settlement with Epic Games. As reported, the long-standing 30 percent transaction fee is being eliminated, with in-app purchases dropping to 20 percent and subscriptions to 10 percent, plus an additional 5 percent when developers use Google’s billing system. Rollout is phased: the EEA, UK, and U.S. by June 30, 2026, other regions later, with global availability planned by September 30, 2027. Until a region’s changes take effect, earlier tiers apply, including 15 percent on the first $1 million of annual revenue and 30 percent above that in many markets.
Verdict: depends on your numbers. Small studios earning under $1 million annually pay low rates on both stores. Larger games should model both fee structures, and keep in mind that these terms are in motion. Build a sheet that lets you change the commission and see the result, then update it each quarter.
Round 4: Development Tools and Technology
For studios using a cross-platform engine, this round is closer than the old rivalry suggests.
| Area | iOS | Android |
| Native languages | Swift, with Objective-C legacy | Kotlin and Java, with C++ through the NDK |
| IDE | Xcode, which requires a Mac | Android Studio on Windows, macOS, or Linux |
| Graphics API | Metal | Vulkan and OpenGL ES |
| Texture compression | ASTC on modern devices | ASTC on modern devices, with ETC2 as an older fallback |
| Architecture | ARM64 | ARM64 required for new submissions |
| Emulator or simulator | Xcode simulator, limited for graphics testing | Android emulator, also limited for performance |
Smartphone game development rarely happens in native code alone. Most mobile games are not written natively. Unity, Unreal Engine, Godot, and Cocos let studios build once and export to both, and the engine handles the platform differences for rendering and input. That makes the engine choice more important than the platform choice for most teams. Our guides to Unity game development and cross-platform strategy cover the trade-offs.
The one hard requirement is a Mac. Building and submitting an iOS app needs Xcode, which runs only on macOS, so a team without Apple hardware must either buy it or rent a cloud Mac build service.
Verdict: even. Native tooling differs, and cross-platform engines hide most of it. The Mac requirement is the only real friction.
Round 5: Device Fragmentation and Testing
This is where iOS wins decisively. Apple controls both the hardware and the operating system, so the testing matrix is small: a handful of current iPhones and iPads, plus a couple of older ones that set the performance floor. Updates reach most users quickly.
Android is a different universe. Thousands of device models from dozens of manufacturers run different chipsets, screen sizes, aspect ratios, GPUs, memory sizes, and manufacturer-customized versions of the OS. A bug can appear on one phone family and nowhere else. Performance on a flagship says almost nothing about performance on a budget handset, which is the device many of your players actually own.
The practical consequences:
- Budget more QA for Android. Plan a device matrix by market: the top devices in your target countries, plus low-end and mid-range representatives. Our game testing practice builds these matrices from real install-base data.
- Set performance targets against the weakest supported device, not the best.
- Use cloud device farms to broaden coverage without buying hundreds of phones.
- Design with scalable quality tiers so low-end devices get a reduced but stable experience.
Verdict: iOS. Fewer devices mean fewer surprises and a cheaper test cycle. Android’s fragmentation is manageable, though it is a permanent line in the budget.
Round 6: Publishing and Store Rules
Both stores review submissions, with different personalities.
| Area | App Store | Google Play |
| Review speed | Typically one to three days, longer if rejected | Often faster, in hours to a few days |
| Review style | Manual and strict, with detailed guidelines | Heavily automated, with stricter checks for new accounts |
| Rejection risks | Design, privacy, payments, and content guideline issues | Policy, data safety, and permission issues |
| Testing channels | TestFlight for beta distribution | Internal, closed, and open testing tracks |
| New account hurdles | Developer enrollment and verification | Newly created personal accounts must complete a closed test with at least 12 testers for 14 days before applying for production access, as widely documented |
The Google Play closed-testing requirement catches many new indie developers off guard. As documented, it applies to personal developer accounts created after November 2023 and requires a minimum number of testers opted in for a continuous period before production access is granted. Organization accounts follow different paths. Rules like this change, so check the current requirement in the Play Console before planning a launch date.
Apple’s review is slower and stricter in tone, and a rejection can cost days. Teams that read the App Store Review Guidelines in advance, and test every purchase flow and privacy disclosure, rarely face surprises. Apple also introduced App Tracking Transparency with iOS 14.5, which requires user permission for cross-app tracking and has reshaped mobile advertising attribution.
Verdict: depends on your patience. Android is faster to publish once you are through the gate, and iOS is more predictable once you know the rules.
Round 7: Monetization and Advertising
Monetization strategy often matters more than platform choice.
- In-app purchases and premium pricing perform better on iOS, where spending per user is higher, and players are more accustomed to paying.
- Ad-supported games can perform well on both, though iOS commands higher ad rates in many markets, and Android’s larger audience supplies volume.
- Subscriptions are strong on iOS, which in 2025 accounted for roughly 73 percent of subscription spending according to the market report cited above.
- Emerging markets monetize more through ads and low-price purchases, and Android dominates those markets.
- Alternative payments are expanding. External payment links and alternative billing, where permitted, can reduce store fees, and they carry their own conversion and compliance costs.
A free-to-play game aimed at the U.S., Canada, Australia, or Western Europe should weigh iOS heavily. A casual ad-funded game aimed at South Asia, Africa, or Latin America should lead with Android.
Verdict: iOS, with caveats. The money per player is better on Apple’s side, and the caveats are markets and models where Android’s scale wins.
Round 8: Growth and Market Direction
Direction matters because a game launched today is judged over years. Android’s spending growth is outpacing iOS in the latest quarter reported, at about 10 percent against about 3 percent year over year. Apple’s global share of web traffic has been rising, and in the United States smartphone sales swung to roughly 51 percent iOS and 49 percent Android in the second quarter of 2026, after iOS took 69 percent in the fourth quarter of 2025, according to Counterpoint figures cited by MobiLoud. Regulatory change is loosening both stores’ control over payments and distribution, which could shift the economics over the next few years.
Verdict: Android, narrowly. The spending growth rate favors it, and the regulatory picture is uncertain for both.
The Scorecard: Which Platform Should Go First?
| Your Situation | Lead With | Reasoning |
| Premium or spend-heavy free-to-play game aimed at North America, Western Europe, or Australia | iOS | Higher spend per user, simpler testing |
| Ad-funded casual game aimed at India, Southeast Asia, Africa, or Latin America | Android | Massive audience, ad-driven economics |
| Small team with a tight QA budget | iOS first, then Android | Smaller device matrix means fewer launch bugs |
| Global launch with a cross-platform engine | Both, staged | Soft launch on one, then expand |
| Game that needs maximum reach and brand awareness | Android | Largest installed base |
| No Apple hardware and a very tight budget | Android first | Avoids the Mac requirement until revenue arrives |
| Hardware-intensive 3D title | Test both, then decide | Performance floor varies widely on Android |
Many studios soft launch on one platform in a few smaller markets, tune the economy using real retention and revenue data, and then expand. Whichever platform leads, plan for the second from the start, because a codebase built with both in mind costs far less than one retrofitted later.
Cross Platform Games: The Practical Answer for Most Studios
The framing of Android versus iOS assumes a choice. For most teams, the better question is how to ship both without doubling the work. Cross-platform games built in a mature engine share one codebase, one art pipeline, and one design, with thin platform layers for purchases, notifications, sign-in, and store integrations.
The savings are real, though they are not automatic. Cross-platform builds still need platform-specific testing, store assets, and compliance work. Performance tuning differs by device class, and some features, such as particular platform services, need separate implementations. The pattern that works is to design for the lowest common capability, add platform polish where it pays off, and test on real devices of both kinds. Our mobile game development team plans both platforms together for exactly this reason.
Cobweb Games’ Approach to Smartphone Game Development
Platform strategy at Cobweb Games begins with the business model and the target markets, since those two factors usually decide the lead platform before a line of code is written. We build in engines that target both stores, set performance budgets against the weakest supported device, and plan a staged launch with soft-launch data driving the expansion. Studios working with us on mobile game development get a platform plan with the fee assumptions written down and updated as store terms change.
Common Platform Mistakes
- Choosing by personal preference. The founder’s own phone is not a market study.
- Ignoring regional splits. A global share number hides the fact that your target country may be 90 percent one platform.
- Budgeting too little for Android QA. Fragmentation bugs surface in reviews, not in demos.
- Hard-coding store fees into the model. Fee structures changed in 2026 and are still moving.
- Skipping policy reading. Both stores reject games over rules that were published months earlier.
- Forgetting the Google Play testing requirement. New personal accounts can lose weeks to it.
- Treating cross-platform as free. It saves work and still needs testing on both sides.
Frequently Asked Questions
Is Android or iOS better for game development?
Neither wins outright. Android has the larger global audience and iOS earns more per user. The better choice depends on your target countries, monetization model, team, and budget, and many studios launch on both.
Which platform makes more money for mobile games?
iOS. In 2025, the App Store captured roughly 64 percent of mobile game spending according to a published market report, despite having a smaller share of users and downloads than Google Play.
Is it cheaper to develop for Android or iOS?
Android has a lower account fee, a one-time $25 fee against Apple’s $99 per year, and runs on any desktop OS. Android testing usually costs more because of device fragmentation, while iOS needs Apple hardware for builds.
Should I launch on both platforms at the same time?
Not necessarily. Many studios soft launch on one platform in a few markets, tune the game with real data, then expand. A shared codebase makes the second platform much cheaper to add.
How long does app store review take?
Apple’s review typically takes one to three days, and Google’s is often faster, though both vary and new accounts or flagged submissions can take longer. Allow buffer in your launch plan.
Can I build one game for both Android and iOS?
Yes. Engines such as Unity, Unreal Engine, Godot, and Cocos export to both from a single project. You still need platform-specific testing, store setup, and compliance work.
Outsourcing Done Right Looks Like a Second Studio, Not a Vendor
The studios that get the most out of game art outsourcing stop treating it as a transaction and start treating it as an extension of their own team. That means a real brief, a real feedback loop, and a partner chosen for fit rather than the lowest quote on the page. Cobweb Games works as exactly that kind of extension, running as an integrated art department for studios that need production capacity without the overhead of building one internally.
